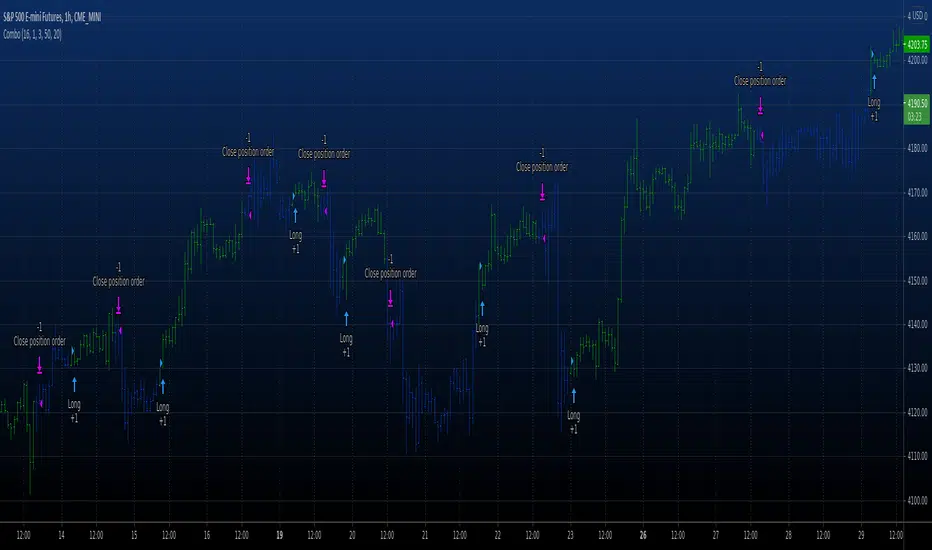
Combo Backtest 123 Reversal & Psychological line This is combo strategies for get a cumulative signal.
First strategy
This System was created from the Book "How I Tripled My Money In The
Futures Market" by Ulf Jensen, Page 183. This is reverse type of strategies.
The strategy buys at market, if close price is higher than the previous close
during 2 days and the meaning of 9-days Stochastic Slow Oscillator is lower than 50.
The strategy sells at market, if close price is lower than the previous close price
during 2 days and the meaning of 9-days Stochastic Fast Oscillator is higher than 50.
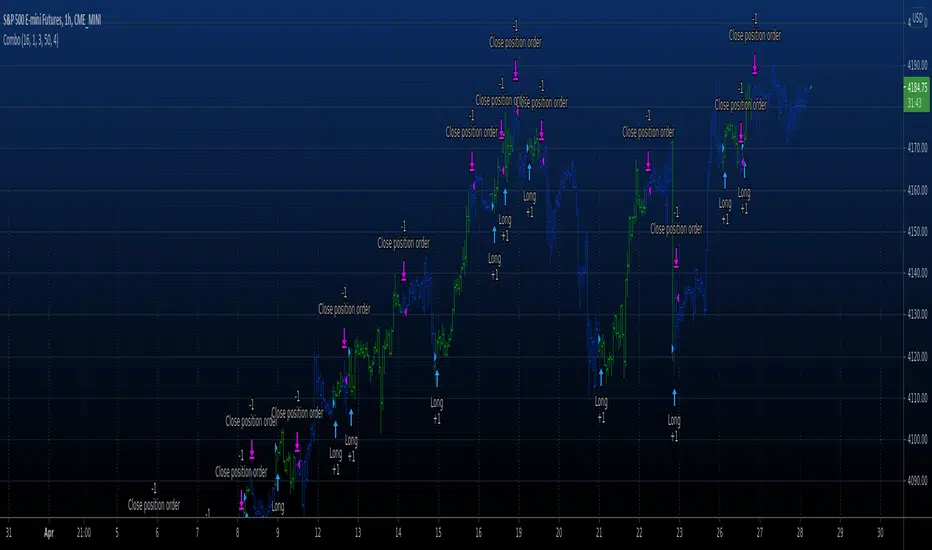
Second strategy
Psychological line (PSY), as an indicator, is the ratio of the number of
rising periods over the total number of periods. It reflects the buying
power in relation to the selling power.
If PSY is above 50%, it indicates that buyers are in control. Likewise,
if it is below 50%, it indicates the sellers are in control. If the PSY
moves along the 50% area, it indicates balance between the buyers and
sellers and therefore there is no direction movement for the market.
WARNING:
- For purpose educate only
ค้นหาในสคริปต์สำหรับ "the strat"
Combo Backtest 123 Reversal & Prime Number Oscillator This is combo strategies for get a cumulative signal.
First strategy
This System was created from the Book "How I Tripled My Money In The
Futures Market" by Ulf Jensen, Page 183. This is reverse type of strategies.
The strategy buys at market, if close price is higher than the previous close
during 2 days and the meaning of 9-days Stochastic Slow Oscillator is lower than 50.
The strategy sells at market, if close price is lower than the previous close price
during 2 days and the meaning of 9-days Stochastic Fast Oscillator is higher than 50.
Second strategy
Determining market trends has become a science even though a high number or people
still believe it’s a gambling game. Mathematicians, technicians, brokers and investors
have worked together in developing quite several indicators to help them better understand
and forecast market movements.
Developed by Modulus Financial Engineering Inc., the prime number oscillator indicates the
nearest prime number, be it at the top or the bottom of the series, and outlines the
difference between that prime number and the respective series.
WARNING:
- For purpose educate only
- This script to change bars colors.
Combo Backtest 123 Reversal & Prime Number Bands This is combo strategies for get a cumulative signal.
First strategy
This System was created from the Book "How I Tripled My Money In The
Futures Market" by Ulf Jensen, Page 183. This is reverse type of strategies.
The strategy buys at market, if close price is higher than the previous close
during 2 days and the meaning of 9-days Stochastic Slow Oscillator is lower than 50.
The strategy sells at market, if close price is lower than the previous close price
during 2 days and the meaning of 9-days Stochastic Fast Oscillator is higher than 50.
Second strategy
Determining market trends has become a science even though a high number
or people still believe it’s a gambling game. Mathematicians, technicians,
brokers and investors have worked together in developing quite several
indicators to help them better understand and forecast market movements.
The Prime Number Bands indicator was developed by Modulus Financial Engineering
Inc. This indicator is charted by indentifying the highest and lowest prime number
in the neighborhood and plotting the two series as a band.
WARNING:
- For purpose educate only
- This script to change bars colors.

Candle Percent Volatility by AllenlkThis indicator gives you the percentage movement of each candle. Measurements are taken between the candle High point and Low point, and also between the Open and Close and calculated in percent %. From there it smooths out the data with a moving average. This gives you an idea of how much volatility is within each candle given the time resolution of the chart.
I like to use this information as a way to turn off a strategy, or select a proper time resolution for a strategy. If each candle has less than 2.5% Volatility most strategies will typically buy and sell rapidly at prices that are too close together, potentially losing money. During those times it seems best to either temporarily turn off the strategy, change the time resolution or switch to another strategy.

HOLP/LOHPThe HOLP strategy was developed by trader-author John F. Carter in his book 'Mastering the trade: proven techniques for profiting from intraday and swing trading set ups' (ISBN 0-07-145958-8). The strategy, which gives buy signals, is a reversal strategy. Reversal strategies try to determine the point in time when a trend reverses direction. In his book John F. Carter is actually skeptical of taking a position against the trend, quoting classics like "never catch a falling knife" (buy a steep sell off) and "never step in front of a train" (short sell a strong market). Given his skepticism he decides to base his strategy on the one single factor which he deems relevant: the market price.

Combo Backtest 123 Reversal & Positive Volume Index This is combo strategies for get a cumulative signal.
First strategy
This System was created from the Book "How I Tripled My Money In The
Futures Market" by Ulf Jensen, Page 183. This is reverse type of strategies.
The strategy buys at market, if close price is higher than the previous close
during 2 days and the meaning of 9-days Stochastic Slow Oscillator is lower than 50.
The strategy sells at market, if close price is lower than the previous close price
during 2 days and the meaning of 9-days Stochastic Fast Oscillator is higher than 50.
Second strategy
The theory behind the indexes is as follows: On days of increasing volume,
you can expect prices to increase, and on days of decreasing volume, you can
expect prices to decrease. This goes with the idea of the market being in-gear
and out-of-gear. Both PVI and NVI work in similar fashions: Both are a running
cumulative of values, which means you either keep adding or subtracting price
rate of change each day to the previous day`s sum. In the case of PVI, if today`s
volume is less than yesterday`s, don`t add anything; if today`s volume is greater,
then add today`s price rate of change. For NVI, add today`s price rate of change
only if today`s volume is less than yesterday`s.
WARNING:
- For purpose educate only
- This script to change bars colors.

Combo Backtest 123 Reversal & Pivot Point V2 This is combo strategies for get a cumulative signal.
First strategy
This System was created from the Book "How I Tripled My Money In The
Futures Market" by Ulf Jensen, Page 183. This is reverse type of strategies.
The strategy buys at market, if close price is higher than the previous close
during 2 days and the meaning of 9-days Stochastic Slow Oscillator is lower than 50.
The strategy sells at market, if close price is lower than the previous close price
during 2 days and the meaning of 9-days Stochastic Fast Oscillator is higher than 50.
Second strategy
Pivot points simply took the high, low, and closing price from the previous period and
divided by 3 to find the pivot. From this pivot, traders would then base their
calculations for three support, and three resistance levels. The calculation for the most
basic flavor of pivot points, known as ‘floor-trader pivots’, along with their support and
resistance levels.
WARNING:
- For purpose educate only
- This script to change bars colors.

Combo Backtest 123 Reversal & Pivot Detector Oscillator Copyright by HPotter v1.0 20/04/2021
This is combo strategies for get a cumulative signal.
First strategy
This System was created from the Book "How I Tripled My Money In The
Futures Market" by Ulf Jensen, Page 183. This is reverse type of strategies.
The strategy buys at market, if close price is higher than the previous close
during 2 days and the meaning of 9-days Stochastic Slow Oscillator is lower than 50.
The strategy sells at market, if close price is lower than the previous close price
during 2 days and the meaning of 9-days Stochastic Fast Oscillator is higher than 50.
Second strategy
The Pivot Detector Oscillator, by Giorgos E. Siligardos
The related article is copyrighted material from Stocks & Commodities 2009 Sep
WARNING:
- For purpose educate only
- This script to change bars colors.
Combo Backtest 123 Reversal & PFE (Polarized Fractal Efficiency) This is combo strategies for get a cumulative signal.
First strategy
This System was created from the Book "How I Tripled My Money In The
Futures Market" by Ulf Jensen, Page 183. This is reverse type of strategies.
The strategy buys at market, if close price is higher than the previous close
during 2 days and the meaning of 9-days Stochastic Slow Oscillator is lower than 50.
The strategy sells at market, if close price is lower than the previous close price
during 2 days and the meaning of 9-days Stochastic Fast Oscillator is higher than 50.
Second strategy
The Polarized Fractal Efficiency (PFE) indicator measures the efficiency
of price movements by drawing on concepts from fractal geometry and chaos
theory. The more linear and efficient the price movement, the shorter the
distance the prices must travel between two points and thus the more efficient
the price movement.
WARNING:
- For purpose educate only
- This script to change bars colors.
Combo Backtest 123 Reversal & Perfomance indexThis is combo strategies for get a cumulative signal.
First strategy
This System was created from the Book "How I Tripled My Money In The
Futures Market" by Ulf Jensen, Page 183. This is reverse type of strategies.
The strategy buys at market, if close price is higher than the previous close
during 2 days and the meaning of 9-days Stochastic Slow Oscillator is lower than 50.
The strategy sells at market, if close price is lower than the previous close price
during 2 days and the meaning of 9-days Stochastic Fast Oscillator is higher than 50.
Second strategy
The Performance indicator or a more familiar term, KPI (key performance indicator),
is an industry term that measures the performance. Generally used by organizations,
they determine whether the company is successful or not, and the degree of success.
It is used on a business’ different levels, to quantify the progress or regress of a
department, of an employee or even of a certain program or activity. For a manager
it’s extremely important to determine which KPIs are relevant for his activity, and
what is important almost always depends on which department he wants to measure the
performance for. So the indicators set for the financial team will be different than
the ones for the marketing department and so on.
Similar to the KPIs companies use to measure their performance on a monthly, quarterly
and yearly basis, the stock market makes use of a performance indicator as well, although
on the market, the performance index is calculated on a daily basis. The stock market
performance indicates the direction of the stock market as a whole, or of a specific stock
and gives traders an overall impression over the future security prices, helping them decide
the best move. A change in the indicator gives information about future trends a stock could
adopt, information about a sector or even on the whole economy. The financial sector is the
most relevant department of the economy and the indicators provide information on its overall
health, so when a stock price moves upwards, the indicators are a signal of good news. On the
other hand, if the price of a particular stock decreases, that is because bad news about its
performance are out and they generate negative signals to the market, causing the price to go
downwards. One could state that the movement of the security prices and consequently, the movement
of the indicators are an overall evaluation of a country’s economic trend.
WARNING:
- For purpose educate only
- This script to change bars colors.

Combo Backtest 123 Reversal & Percentage Volume Oscillator (PVO) This is combo strategies for get a cumulative signal.
First strategy
This System was created from the Book "How I Tripled My Money In The
Futures Market" by Ulf Jensen, Page 183. This is reverse type of strategies.
The strategy buys at market, if close price is higher than the previous close
during 2 days and the meaning of 9-days Stochastic Slow Oscillator is lower than 50.
The strategy sells at market, if close price is lower than the previous close price
during 2 days and the meaning of 9-days Stochastic Fast Oscillator is higher than 50.
Second strategy
The Percentage Volume Oscillator (PVO) is a momentum oscillator for volume.
PVO measures the difference between two volume-based moving averages as a
percentage of the larger moving average. As with MACD and the Percentage Price
Oscillator (PPO), it is shown with a signal line, a histogram and a centerline.
PVO is positive when the shorter volume EMA is above the longer volume EMA and
negative when the shorter volume EMA is below. This indicator can be used to define
the ups and downs for volume, which can then be use to confirm or refute other signals.
Typically, a breakout or support break is validated when PVO is rising or positive.
WARNING:
- For purpose educate only
- This script to change bars colors.

Combo Backtest 123 Difference between price and MA This is combo strategies for get a cumulative signal.
First strategy
This System was created from the Book "How I Tripled My Money In The
Futures Market" by Ulf Jensen, Page 183. This is reverse type of strategies.
The strategy buys at market, if close price is higher than the previous close
during 2 days and the meaning of 9-days Stochastic Slow Oscillator is lower than 50.
The strategy sells at market, if close price is lower than the previous close price
during 2 days and the meaning of 9-days Stochastic Fast Oscillator is higher than 50.
Second strategy
Percent difference between price and MA
WARNING:
- For purpose educate only
- This script to change bars colors.
Scalping Dips On Trend (by Coinrule)Coinrule's Community is an excellent source of inspiration for our trading strategies.
In these months of Bull Market, our traders opted mostly on buy-the-dips strategies, which resulted in great returns recently. But there has been an element that turned out to be the cause for deep division among the Community.
Is it advisable or not to use a stop-loss during a Bull Market?
This strategy comes with a large stop-loss to offer a safer alternative for those that are not used to trade with a downside protection.
Entry
The strategy buys only when the price is above the Moving Average 50 , making it less risky to buy the dip, which is set to 2%.
The preferred time frame is 1-hour.
The stop-loss is set to be quite loose to increase the chances of closing the trade in profit, yet protecting from unexpected larger drawdowns that could undermine the allocation's liquidity.
Exit
Stop loss: 10%
Take Profit: 3%
In times of Bull Market, such a trading system has a very high percentage of trades closed in profit (ranging between 70% to 80%), which makes it still overall profitable to have a stop-loss three times larger than the take profit.
Pro tip: use a larger stop-loss only when you expect to close in profit most of the trades!
The strategy assumes each order to trade 30% of the available capital and opens a trade at a time. A trading fee of 0.1% is taken into account.

Combo Backtest 123 Percent change bar This is combo strategies for get a cumulative signal.
First strategy
This System was created from the Book "How I Tripled My Money In The
Futures Market" by Ulf Jensen, Page 183. This is reverse type of strategies.
The strategy buys at market, if close price is higher than the previous close
during 2 days and the meaning of 9-days Stochastic Slow Oscillator is lower than 50.
The strategy sells at market, if close price is lower than the previous close price
during 2 days and the meaning of 9-days Stochastic Fast Oscillator is higher than 50.
Second strategy
This histogram displays price or % change from previous bar.
WARNING:
- For purpose educate only
- This script to change bars colors.
Combo Backtest 123 Overbought/Oversold This is combo strategies for get a cumulative signal.
First strategy
This System was created from the Book "How I Tripled My Money In The
Futures Market" by Ulf Jensen, Page 183. This is reverse type of strategies.
The strategy buys at market, if close price is higher than the previous close
during 2 days and the meaning of 9-days Stochastic Slow Oscillator is lower than 50.
The strategy sells at market, if close price is lower than the previous close price
during 2 days and the meaning of 9-days Stochastic Fast Oscillator is higher than 50.
Second strategy
Simple Overbought/Oversold indicator
WARNING:
- For purpose educate only
- This script to change bars colors.

Combo Backtest 123 Negative Volume Index This is combo strategies for get a cumulative signal.
First strategy
This System was created from the Book "How I Tripled My Money In The
Futures Market" by Ulf Jensen, Page 183. This is reverse type of strategies.
The strategy buys at market, if close price is higher than the previous close
during 2 days and the meaning of 9-days Stochastic Slow Oscillator is lower than 50.
The strategy sells at market, if close price is lower than the previous close price
during 2 days and the meaning of 9-days Stochastic Fast Oscillator is higher than 50.
Second strategy
The theory behind the indexes is as follows: On days of increasing
volume, you can expect prices to increase, and on days of decreasing
volume, you can expect prices to decrease. This goes with the idea of
the market being in-gear and out-of-gear. Both PVI and NVI work in similar
fashions: Both are a running cumulative of values, which means you either
keep adding or subtracting price rate of change each day to the previous day`s
sum. In the case of PVI, if today`s volume is less than yesterday`s, don`t add
anything; if today`s volume is greater, then add today`s price rate of change.
For NVI, add today`s price rate of change only if today`s volume is less than
yesterday`s.
WARNING:
- For purpose educate only
- This script to change bars colors.
Combo Backtest 123 Reversal & N Bars Up This is combo strategies for get a cumulative signal.
First strategy
This System was created from the Book "How I Tripled My Money In The
Futures Market" by Ulf Jensen, Page 183. This is reverse type of strategies.
The strategy buys at market, if close price is higher than the previous close
during 2 days and the meaning of 9-days Stochastic Slow Oscillator is lower than 50.
The strategy sells at market, if close price is lower than the previous close price
during 2 days and the meaning of 9-days Stochastic Fast Oscillator is higher than 50.
Second strategy
Evaluates for n number of consecutive higher closes. Returns a value
of 1 when the condition is true or 0 when false.
WARNING:
- For purpose educate only
- This script to change bars colors.

Combo Backtest 123 Reversal & N Bars Down This is combo strategies for get a cumulative signal.
First strategy
This System was created from the Book "How I Tripled My Money In The
Futures Market" by Ulf Jensen, Page 183. This is reverse type of strategies.
The strategy buys at market, if close price is higher than the previous close
during 2 days and the meaning of 9-days Stochastic Slow Oscillator is lower than 50.
The strategy sells at market, if close price is lower than the previous close price
during 2 days and the meaning of 9-days Stochastic Fast Oscillator is higher than 50.
Second strategy
Evaluates for n number of consecutive lower closes. Returns a value
of 1 when the condition is true or 0 when false.
WARNING:
- For purpose educate only
- This script to change bars colors.

Combo Backtest 123 Reversal & MovROC (KST indicator) This is combo strategies for get a cumulative signal.
First strategy
This System was created from the Book "How I Tripled My Money In The
Futures Market" by Ulf Jensen, Page 183. This is reverse type of strategies.
The strategy buys at market, if close price is higher than the previous close
during 2 days and the meaning of 9-days Stochastic Slow Oscillator is lower than 50.
The strategy sells at market, if close price is lower than the previous close price
during 2 days and the meaning of 9-days Stochastic Fast Oscillator is higher than 50.
Second strategy
This indicator really is the KST indicator presented by Martin Pring.
the KST indicator is a weighted summed rate of change oscillator that
is designed to identify meaningful turns. Various smoothed rate of change
indicators can be combined to form different measurements of cycles.
WARNING:
- For purpose educate only
- This script to change bars colors.
Combo Backtest 123 Reversal & Moving Average Envelopes This is combo strategies for get a cumulative signal.
First strategy
This System was created from the Book "How I Tripled My Money In The
Futures Market" by Ulf Jensen, Page 183. This is reverse type of strategies.
The strategy buys at market, if close price is higher than the previous close
during 2 days and the meaning of 9-days Stochastic Slow Oscillator is lower than 50.
The strategy sells at market, if close price is lower than the previous close price
during 2 days and the meaning of 9-days Stochastic Fast Oscillator is higher than 50.
Second strategy
Moving Average Envelopes are percentage-based envelopes set above and
below a moving average. The moving average, which forms the base for
this indicator, can be a simple or exponential moving average. Each
envelope is then set the same percentage above or below the moving average.
This creates parallel bands that follow price action. With a moving average
as the base, Moving Average Envelopes can be used as a trend following indicator.
However, this indicator is not limited to just trend following. The envelopes
can also be used to identify overbought and oversold levels when the trend is
relatively flat.
WARNING:
- For purpose educate only
- This script to change bars colors.
Combo Backtest 123 Reversal & MA Displaced EnvelopeThis is combo strategies for get a cumulative signal.
First strategy
This System was created from the Book "How I Tripled My Money In The
Futures Market" by Ulf Jensen, Page 183. This is reverse type of strategies.
The strategy buys at market, if close price is higher than the previous close
during 2 days and the meaning of 9-days Stochastic Slow Oscillator is lower than 50.
The strategy sells at market, if close price is lower than the previous close price
during 2 days and the meaning of 9-days Stochastic Fast Oscillator is higher than 50.
Second strategy
Moving Average Displaced Envelope. These envelopes are calculated
by multiplying percentage factors with their displaced expotential
moving average (EMA) core.
How To Trade Using:
Adjust the envelopes percentage factors to control the quantity and
quality of the signals. If a previous high goes above the envelope
a sell signal is generated. Conversely, if the previous low goes below
the envelope a buy signal is given.
WARNING:
- For purpose educate only
- This script to change bars colors.

Multi Moving Average Crossing (by Coinrule)Moving Averages are among the most common trading indicators. They are straightforward to interpret and effective to use.
One of the limitations of using moving averages is they can provide buy and sell signals with a relatively high lag , making it very difficult to spot the lows and tops of the trend.
Moving averages calculated with a low number of periods like the MA9 (the average of the previous nine price periods) react very fast to price moves providing prompt signals. On the other side, more signals may end up with more false-signals and more trades in a loss.
On the contrary, moving averages calculated with a higher number of periods like the MA100 (which considers the previous one hundred price periods) give more reliable signals, but with a delay.
A system catching the crossing of the MA50 over the MA100 is a good compromise for successful long-term strategies. It provides, on average, reliable buy signals.
The Multi Moving Average Crossing Strategy tries to optimize the exit without waiting for the same opposite crossing (MA50 below MA100). It uses the MA9 crossing below the MA50, instead, to spot a better time for selling.
The setup is as follows.
BUY when the Moving Average 50 crosses above the Moving Average 100
SELL when the Moving Average 9 crosses below the Moving Average 50
The higher is the time frame to calculate the Moving Averages, the better is the overall performance of the strategy. The 4-hour (or 6-hour) time frame seems to be the best, even if it results in fewer trades. If you want to trade more still with good results, the 1-hour time is a good compromise.
Advantages of the strategy
This strategy seeks to catch those that are more likely relevant uptrends and close the trade relatively quickly. More trades mean more opportunities. This is especially effective if you run the strategy on all the available coins on the market, as you could do with Coinrule.
Generally, a Multi Moving Averages approach beats the classic crossing strategy involving only two Moving Averages. We backtested a sample of twenty trading pairs to assess the benefits empirically.
The results show that the Multi Moving Average Strategy
outperforms 13 out of 20 times
has 95% higher average return
has 67% higher median return
The strategy assumes each order to trade 30% of the available capital and opens a trade at a time. A trading fee of 0.1% is taken into account.

Combo Backtest 123 Reversal & Money Flow Indicator This is combo strategies for get a cumulative signal.
First strategy
This System was created from the Book "How I Tripled My Money In The
Futures Market" by Ulf Jensen, Page 183. This is reverse type of strategies.
The strategy buys at market, if close price is higher than the previous close
during 2 days and the meaning of 9-days Stochastic Slow Oscillator is lower than 50.
The strategy sells at market, if close price is lower than the previous close price
during 2 days and the meaning of 9-days Stochastic Fast Oscillator is higher than 50.
Second strategy
Indicator plots Money Flow Indicator (Chaikin). This indicator looks
to improve on Larry William's Accumulation Distribution formula that
compared the closing price with the opening price. In the early 1970's,
opening prices for stocks stopped being transmitted by the exchanges.
This made it difficult to calculate Williams' formula. The Chaikin
Oscillator uses the average price of the bar calculated as follows
(High + Low) /2 instead of the Open.
The indicator subtracts a 10 period exponential moving average of the
AccumDist function from a 3 period exponential moving average of the
AccumDist function.
WARNING:
- For purpose educate only
- This script to change bars colors.
